Find slow queries and see why they're slow
Visual explain plans from the collection tab, shell or aggregation editor, a query profiler for slow operations, and live server monitoring.
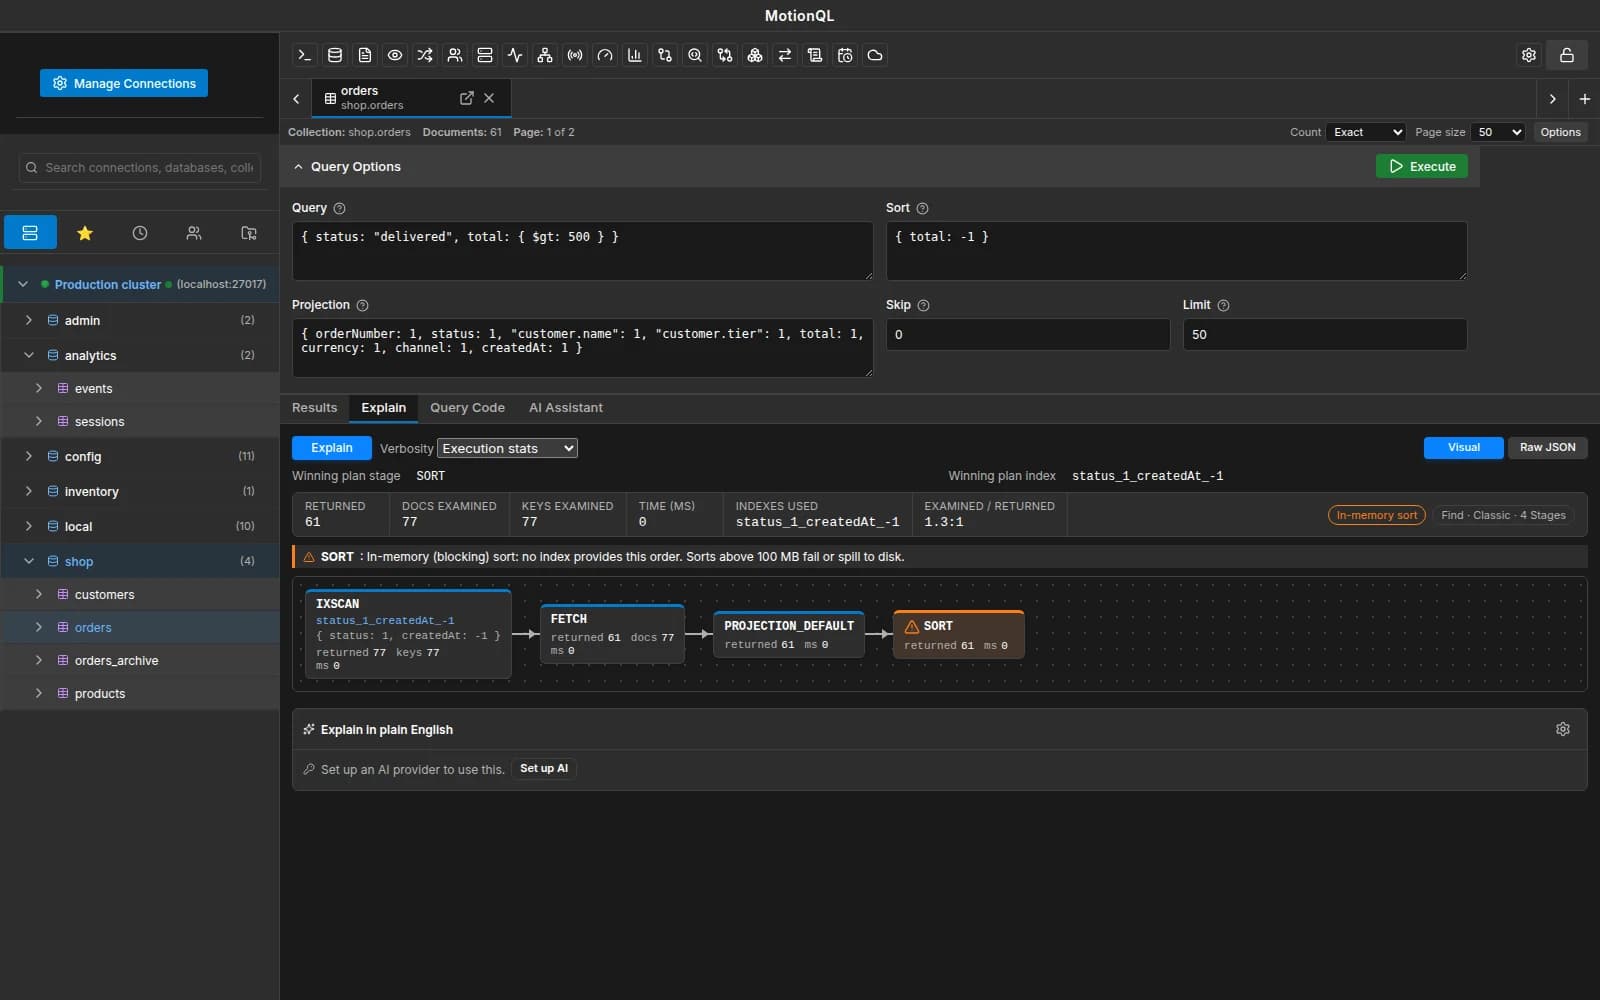
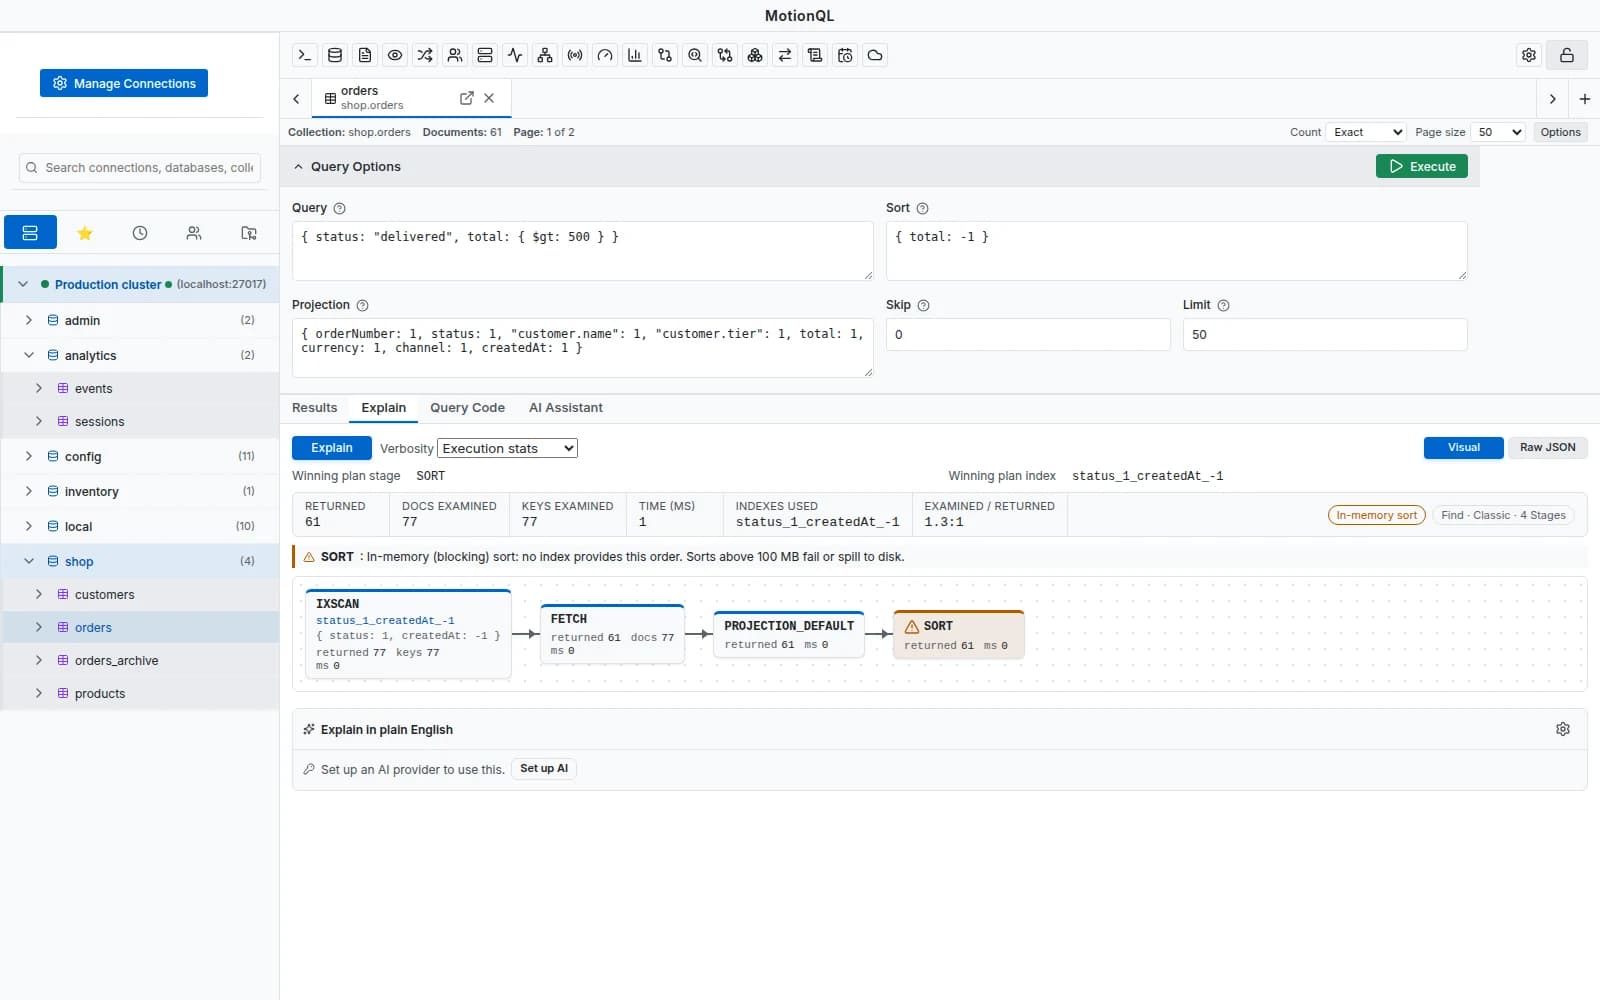
The winning plan as a tree, with index use, documents examined and time.
Find slow queries and fix them
The query profiler, index advice and live server monitoring.
What you can do with it
Live server monitoring
Operations per second, connections, network, memory, WiredTiger cache and queued reads and writes from serverStatus, plus dbStats and the busiest collections. Pause any time.
Explain in the query builder
See keys and documents examined, server time and the winning plan for the query you're building, with index suggestions.
Visual explain
The winning plan as a tree with index use, documents examined and execution time.
Explain anywhere
From the collection tab, IntelliShell or the aggregation editor.
Query profiler
Set the profiling level and slow-operation threshold, review slow operations and clear profiling data.
Running operations
List current operations and kill one (blocked on read-only connections).
Topology
Replica set members and roles, and the shards of a sharded cluster.
AI plan advice
On connections that allow AI, get an explanation of the plan and index advice.
Related features
Your next query deserves a better IDE.
Create a free account, download MotionQL, and paste your Pro key. You'll be querying in under two minutes.